Data Visualization
Traffine effectively visualizes various data including cities and transportation. We provide advanced visualization and analysis utilizing cutting-edge technologies such as WebGIS and QGIS, supporting various formats such as table data, images, and videos. We realize flexible data analysis and visualization tailored to the needs of our customers.
Example Project ❶
Project
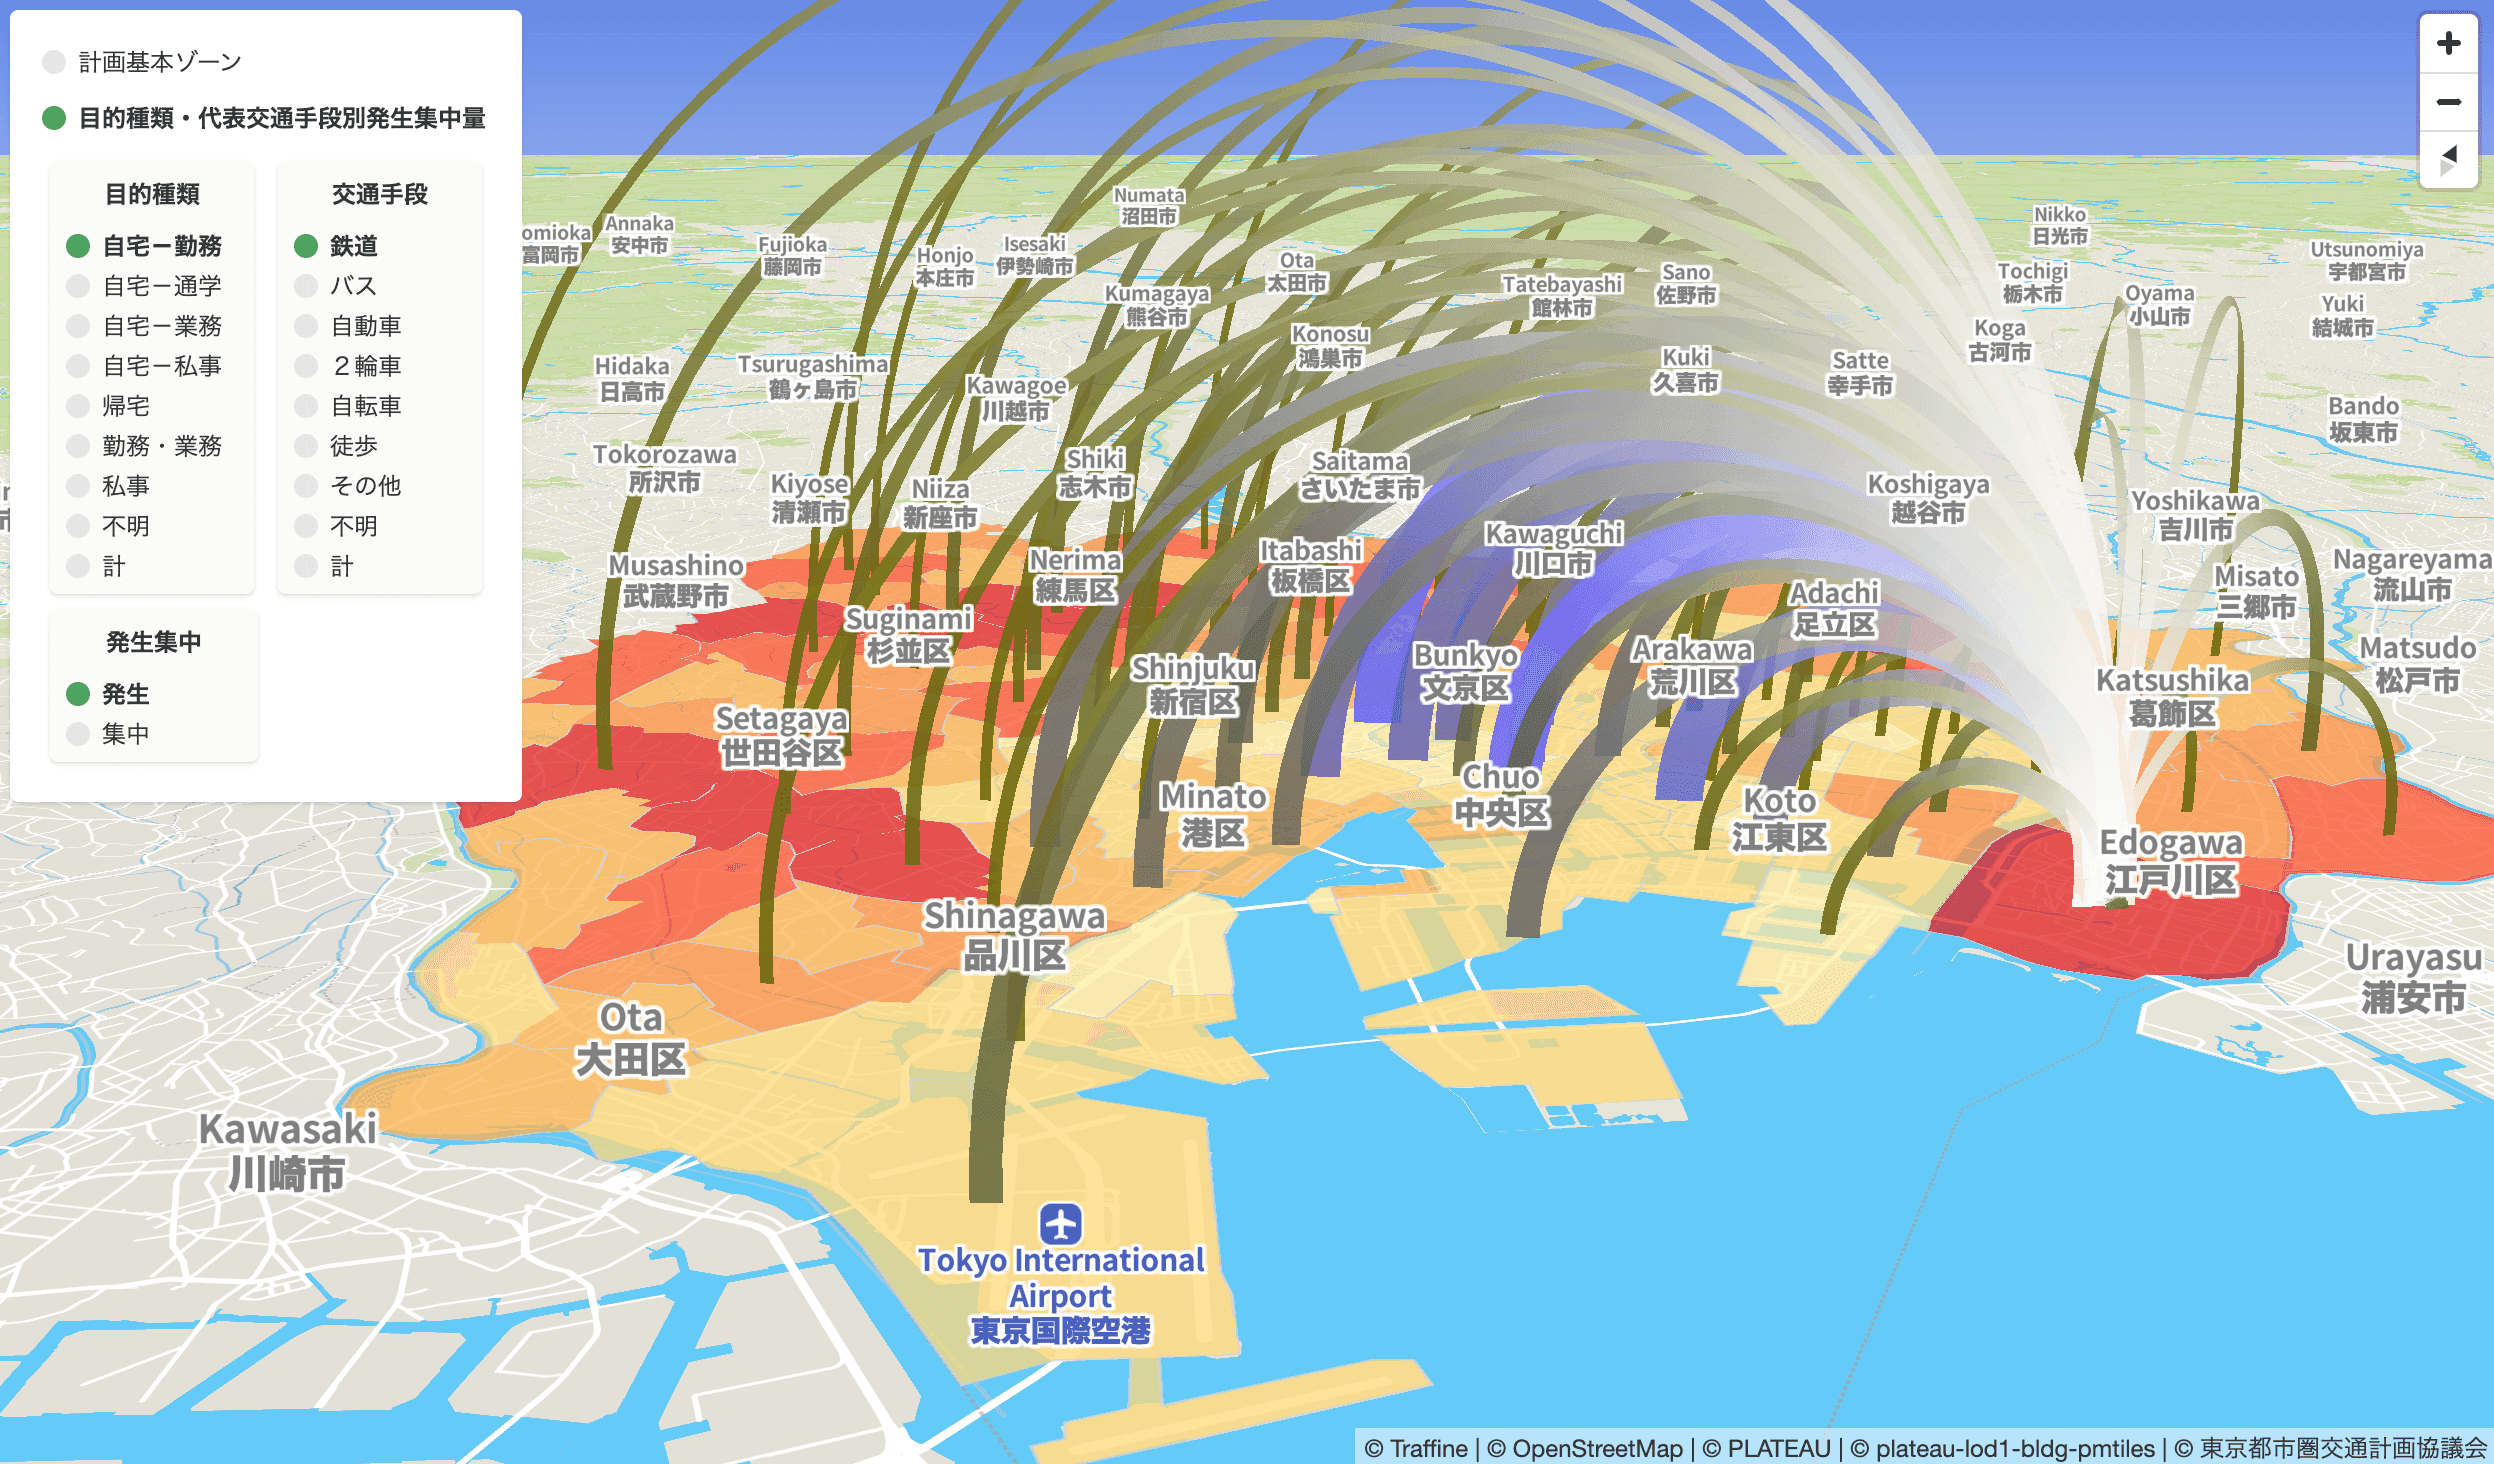
Visualization of Person Trip Data
Description
We visualized the occurrence and concentration, as well as the volume of OD, of person trip data through multiple analysis axes such as purpose type and mode of transportation. In the sample, we visualize Tokyo's person trip data.
Example Project ❷
Project
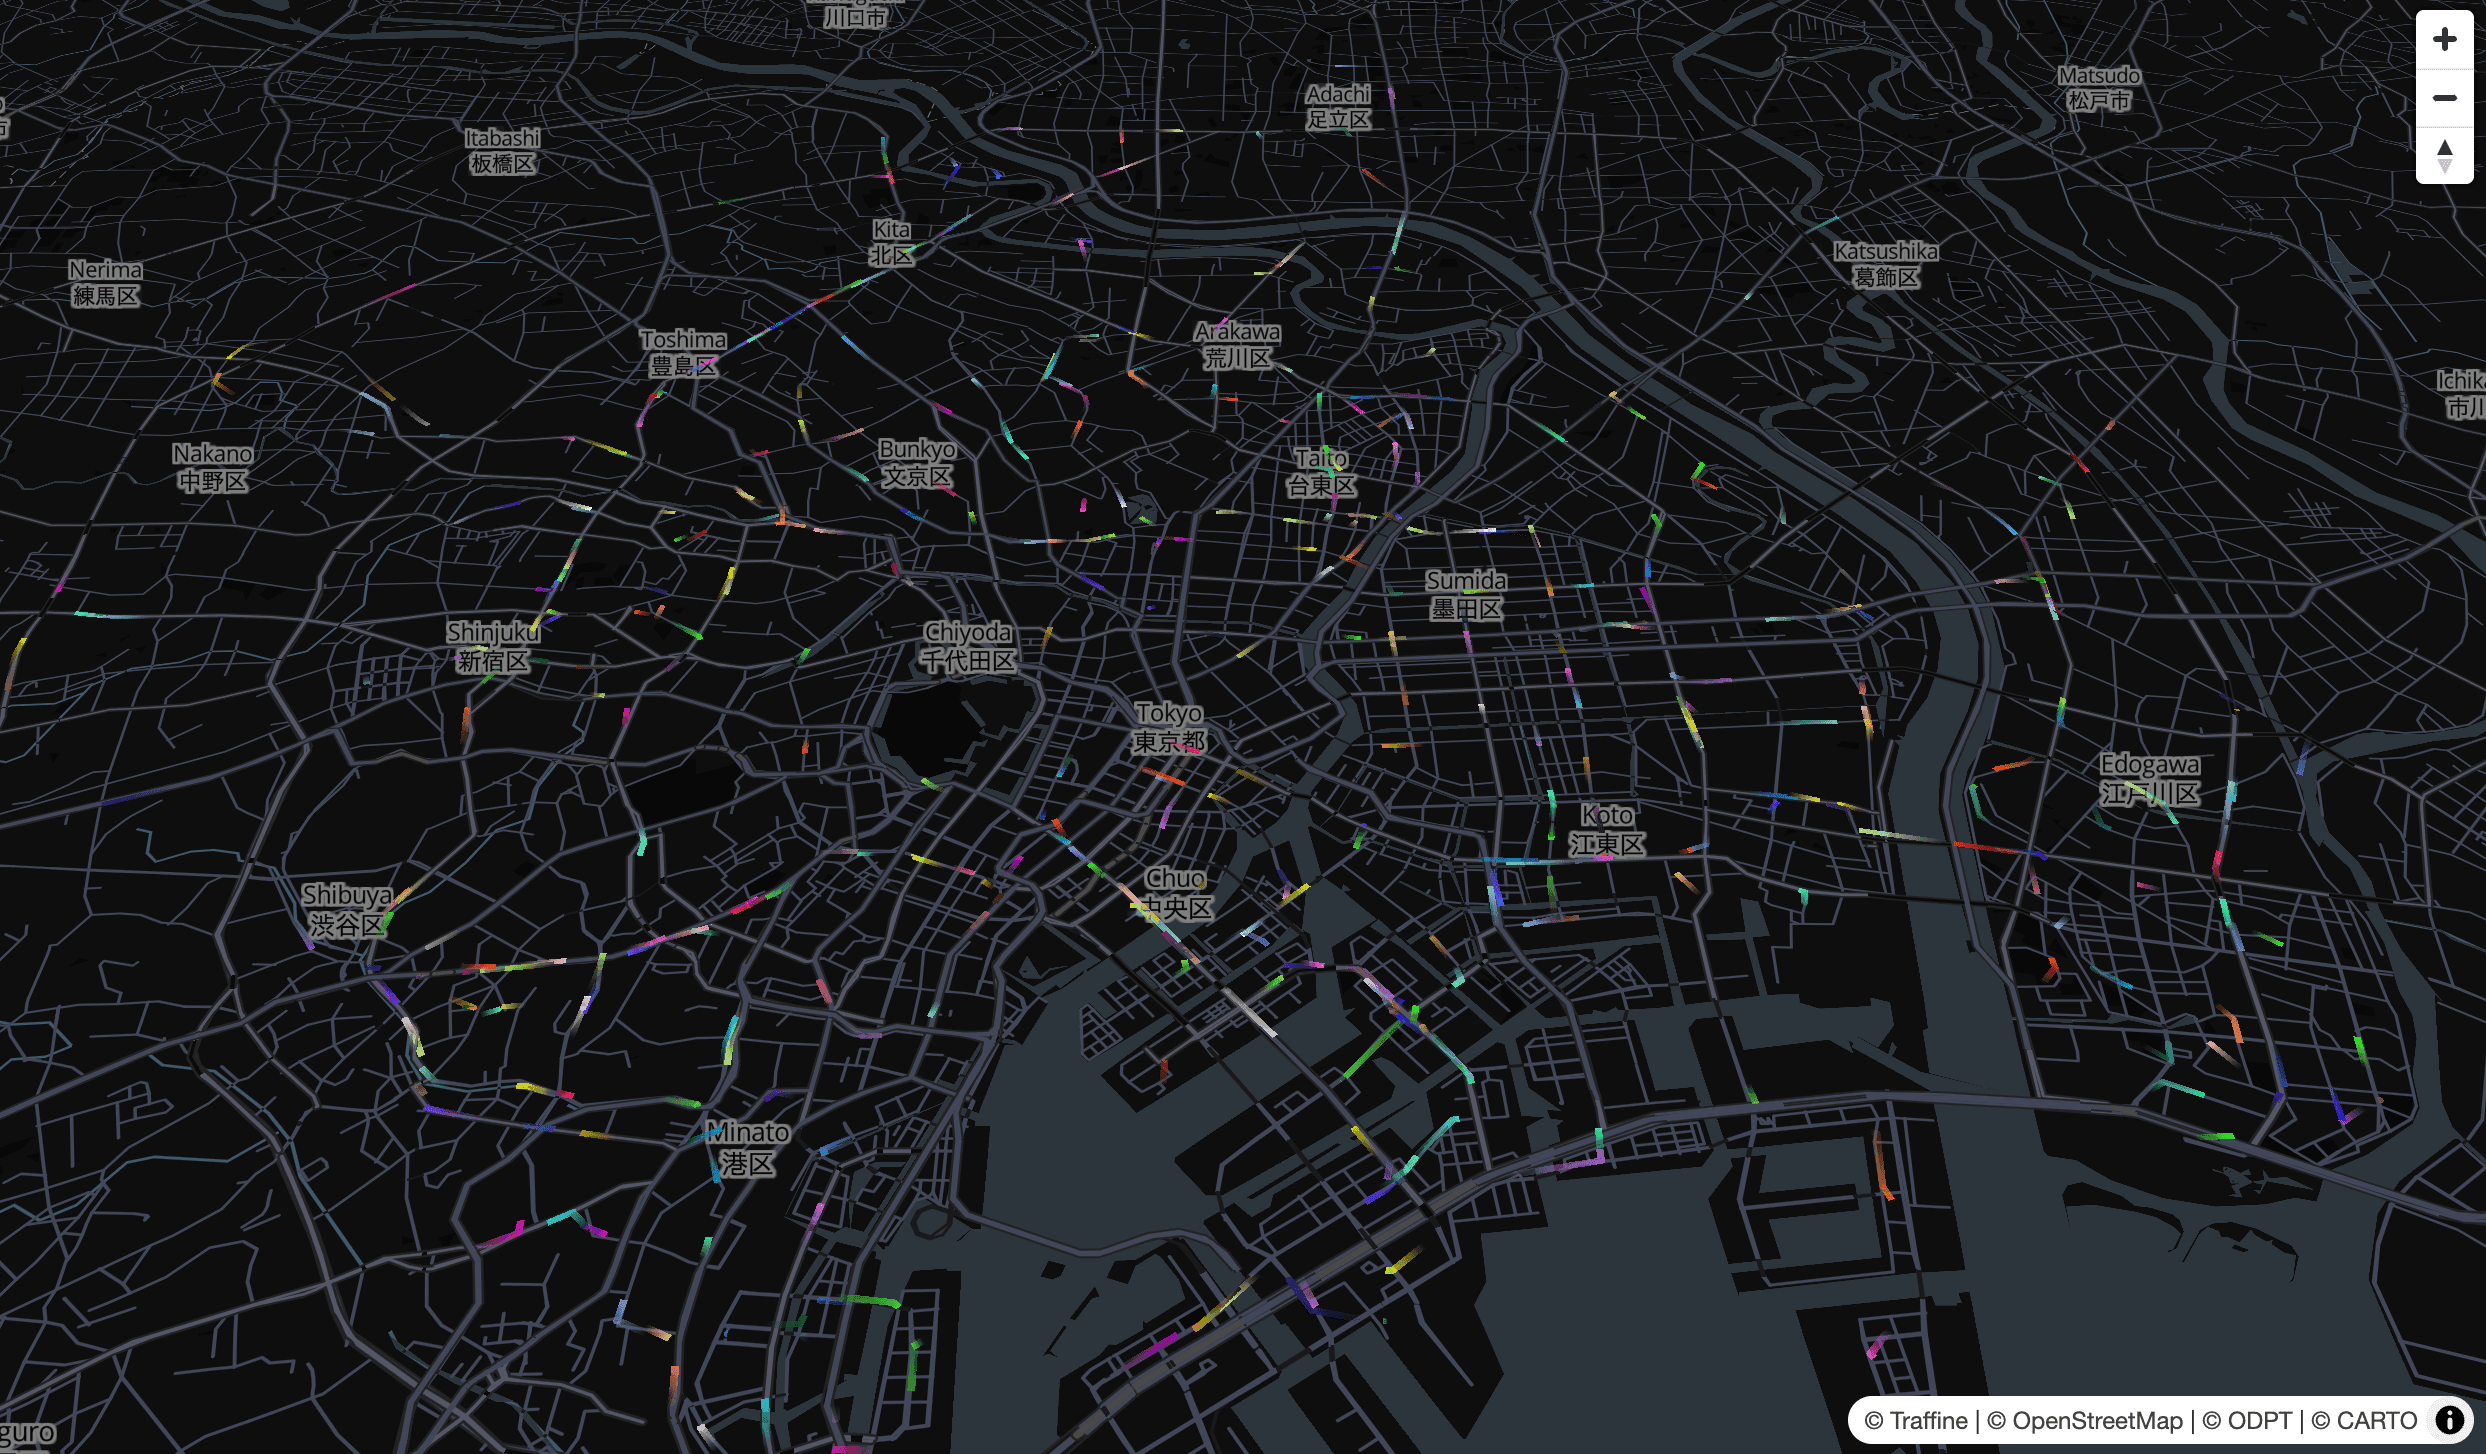
Visualization of GTFS-RT Data
Description
We visualized GTFS-RT (real-time bus location data). In the sample, we visualize Tokyo Metropolitan Bus GTFS-RT data.